Market Updates
market up date Brett Toyne May 19, 2026
market up date Brett Toyne May 19, 2026
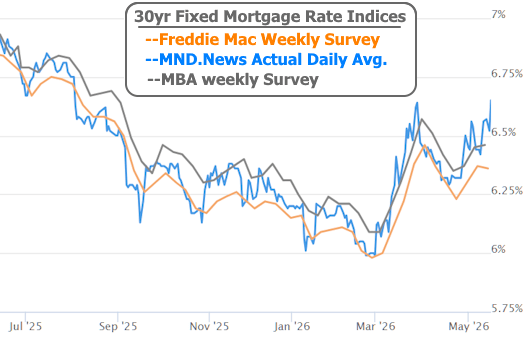
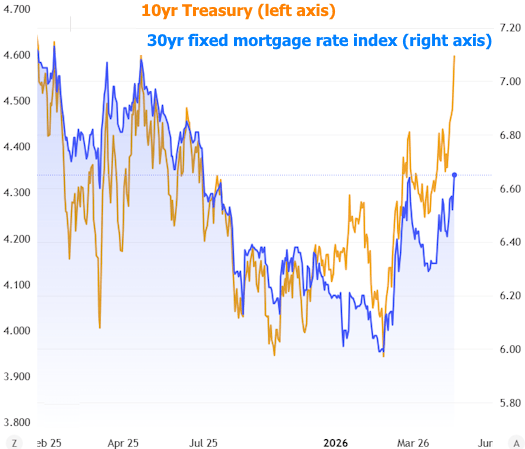
Ask any parent. A lot can change in 9 months. Same story for mortgage rates. During that time, the average 30yr fixed rate dropped 0.65% only to move back up just as much as of the end of the week. This week alone accounted for a 0.23% increase for the average lender as hope quickly faded for a quick end to the Iran war.
Ask any parent. A lot can change in 9 months. Same story for mortgage rates. During that time, the average 30yr fixed rate dropped 0.65% only to move back up just as much as of the end of the week. This week alone accounted for a 0.23% increase for the average lender as hope quickly faded for a quick end to the Iran war.
The war itself has been responsible for essentially all of the 0.65% jump. Here's why:
In addition, the war implies additional funding needs for the government. The issuance of more debt is a key funding source for the government and higher debt issuance begets higher rates, all else equal.
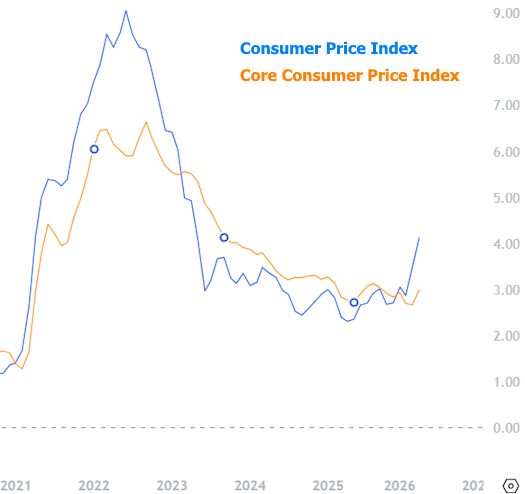
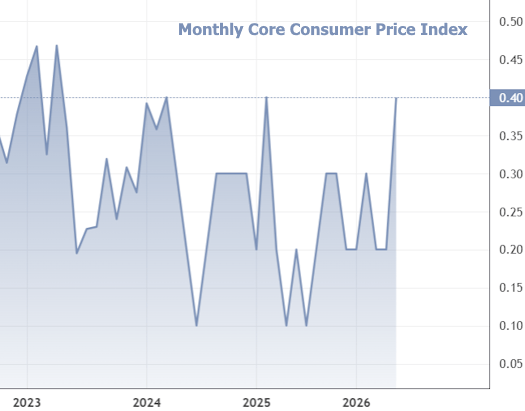
Fresh data out this week showed the inflationary impact of the war flowing through to the domestic economy. The Consumer Price Index (CPI) hit its highest level since 2023. Even if we focus on Core CPI (which excludes food and energy categories), annual inflation was the highest since 2025 and monthly inflation came in tied for the fastest pace since 2023.
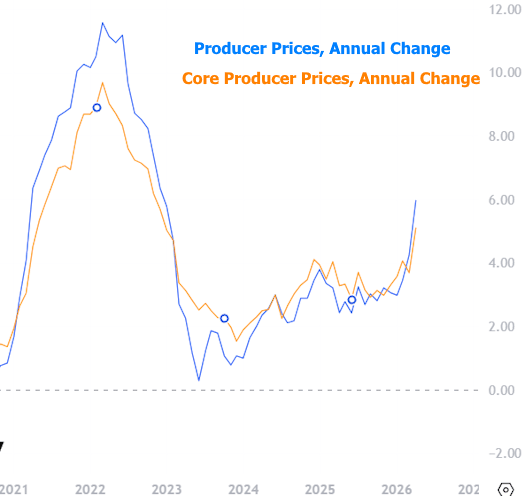
Wholesale level inflation was even worse according to the Producer Price Index (PPI), with the annual rate surging to 6.0%--the highest since late 2022. Core PPI was also the highest since 2022 at 5.2%.
But inflation data itself wasn't as big of a deal this week. The market pushed rates higher right when the war began because it expected these numbers to surge. In other words, the market infers inflation impact based on breaking developments.
On that note, Friday was the worst day we've seen since the start of the war. A certain portion of the trading community was hoping that this week's Trump/Xi summit would set the stage for a diplomatic shift that accelerated a peace deal with Iran. As soon as the summit ended without any news of the sort, the bond market immediately began moving higher in yield/rate.
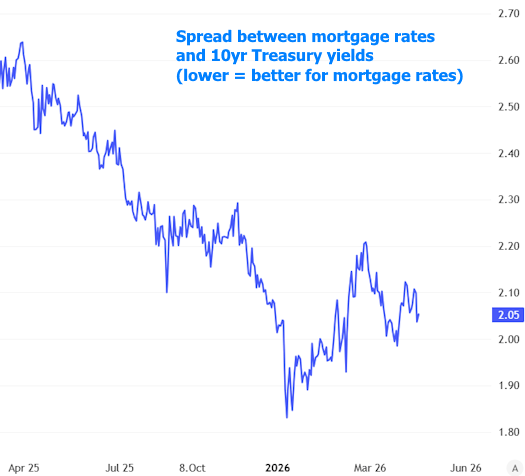
By the end of the day on Friday, 10yr Treasury yields were up more than 0.11% to the highest levels in a year. Mortgage rates "only" back to August levels thanks to increased bond buying on the part of Fannie and Freddie. These purchases of mortgage-backed securities have helped narrow the spread between mortgage rates and Treasury yields.
Looking ahead, the market will remain sensitive to war-related developments. Rates could certainly move back down if a peace deal is achieved soon, but as this week showed, they have no problem moving higher when hopes for a peace deal fade.
|
Rate |
Weekly |
Daily |
|
|
Mortgage News Daily |
|||
|
30YR Fixed |
6.65% |
+0.23 |
+0.13 |
|
15YR Fixed |
6.10% |
+0.11 |
+0.06 |
|
30YR FHA |
6.17% |
+0.24 |
+0.18 |
|
30YR Jumbo |
6.69% |
+0.10 |
+0.04 |
|
7/6 SOFR |
6.49% |
+0.22 |
+0.20 |
|
30YR VA |
6.19% |
+0.24 |
+0.18 |
Rates as of: 5/15
|
Price / Yield |
Change |
|
|
MBS UMBS 5.0 |
97.41 |
-0.72 |
|
10 YR Treasury |
4.5919 |
+0.1069 |
|
30 YR Treasury |
5.1178 |
+0.0874 |
Pricing as of: 5/15 5:15PM EST
|
Value |
Change |
||
|
Mortgage Apps |
May 13 |
290.1 |
+1.68% |
|
Building Permits |
Mar |
1.37M |
-10.79% |
|
Housing Starts |
Mar |
1.5M |
+10.77% |
|
New Home Sales |
Mar |
682K |
+7.4% |
|
Pending Home Sales |
Feb 2 |
73.7 |
+2.22% |
|
Existing Home Sales |
Apr |
4.02M |
+1.01% |
|
Builder Confidence |
Apr |
34 |
-10.53% |
Stay up to date on the latest real estate trends.

energy-efficient home upgrades

Multigenerational Living


Smart Senior Living Decisions

Is Fall & Winter the Best Time to Buy Lake Property in Minnesota?

Central Minnesota lakes

Best Lakeside Communities in Central Minnesota

How Data Centers Affect Homes and the Real Estate Market in 2026

Why a Clear Home Title Matters | How to Fix Deed Issues for Homeowners
With deep market knowledge and a client-first approach, we work together to provide reliable advice, strategic solutions, and personalized service. Whether you're searching for your dream home, selling a property, or exploring investment opportunities, our team is committed to making the process smooth, informed, and successful.

Lorinda Davis
Chuck Davis
Alexandria, MN